Exploring the Native-Immigrant Achievement Gap in the Balkans Using PISA Data
- Yulia Kuzmina
- Jan 17, 2025
- 5 min read

Updated: Jul 16, 2025
Last year, I received a small research grant to explore the native-immigrant achievement and motivation gap in the Balkans using PISA data. This project is exploratory in nature, focusing on understanding differences between native and immigrant pupils in Balkans. Balkan countries and Eastern Europe have more often been sources of emigration to EU countries rather than place of destination. However, in recent years, this trend has changed. Recent war conflicts, including the Russian invasion of Ukraine, have led to increased migration to Eastern Europe and the Balkans. Therefore, the Balkans and Eastern Europe may face challenges in adapting to the influx of immigrants, including the adaptation of immigrant children in schools. From this perspective, it is important to assess how these countries dealt with immigrants in the past and PISA data fits to this aim perfectly.
For those who may not know, PISA (Programme for International Student Assessment) is an international study that evaluates the performance of 15-year-olds in reading, mathematics, and science every three years. While there is some debate about how well PISA results reflect the effectiveness of national educational systems, it remains a valuable source of objective data on education across different countries. Many Eastern European countries have become EU members, demonstrated economic growth, and become more attractive to migrants from less developed countries. Some Balkan countries and Eastern Europe now have a larger proportion of migrants than it was before.
For this project, I’ll be examining the PISA 2018 and 2022 datasets, though I haven’t yet dug into the 2018 data in depth. While the official PISA reports are insightful, they don’t cover every angle, and there’s plenty of room for secondary analysis. That’s where open PISA data (and data from other studies like TIMSS and PIRLS) is incredibly valuable for researchers like me.
For this grant, I’ll write one article, but I’ve decided to share some interesting descriptove statistics here on the blog.
Today, I’ll focus on math and reading performance from PISA 2022, specifically looking at the native-immigrant achievement gap. I selected Balkan countries with at least 5% immigrant students in the PISA sample: Slovenia, Serbia, Montenegro, Croatia, and Greece. To make these comparisons more meaningful, I also included countries with significant immigrant populations—Great Britain, Austria, France, and Italy—each with different approaches to immigrant integration. If I were writing this for an academic paper, I’m sure that editors and reviewers would insist on a clearer and more detailed explanation of the criteria for my country selection! But for now, I’ll leave that to the readers to ponder. 😊
Proportion of Immigrant Students
In the selected countries, the proportion of immigrant students in the PISA 2022 sample ranged from 6% in Montenegro to 26% in Austria. It is worth noting that second-generation immigrants (those born in the host country with immigrant parents) outnumbered first-generation immigrants in all these countries. It's important to say that PISA 2022 data was collected in spring 2022 (in the selected countries), meaning it doesn’t fully capture the influx of immigrants from Russia and Ukraine due to the ongoing Russian invasion in Ukraine. However, once TIMSS 2023 data is available, it could provide a more current picture.
Native vs. Immigrant Performance
Now, let's dive into the math and reading performance of native and immigrant students across the selected countries (Figures 1 and 2). Looking at the math and reading scores, immigrant students generally performed worse than native students across the selected countries (it is expected and nothing new in these results!). However, there were exceptions—Great Britain, Serbia, and Montenegro. In Serbia and Montenegro, no significant difference was found between native and immigrant students in math. In reading, second-generation immigrants in Serbia actually outperformed native students. Meanwhile, in Great Britain, second-generation immigrants scored higher than natives in math, but there was no difference in reading. However, first-generation immigrants in Great Britain scored lower than both native and second-generation students.


To understand how significant these differences were, I calculated Z-scores for each country. Z-scores tell us how far each score is from the country’s average in terms of standard deviation, helping us gauge how large the gap is. Figures 3 and 4 show these differences in Z-scores. The first two columns represent the difference between immigrant (first- and second-generation) and native students, while the third column shows the gap between first- and second-generation immigrant students.
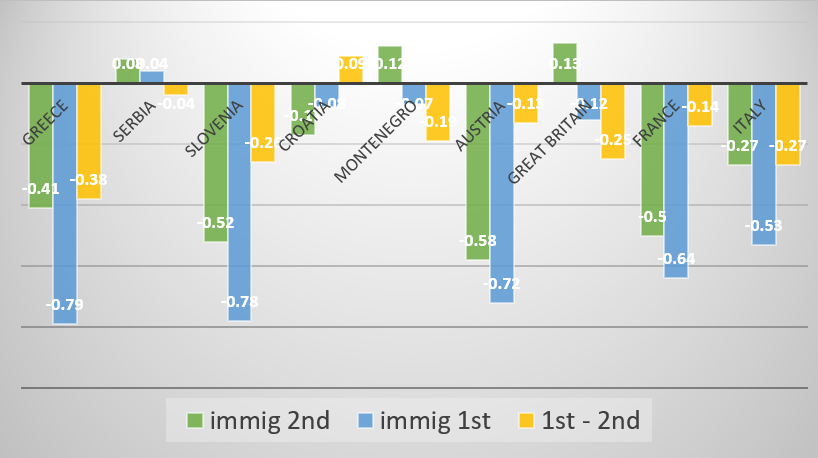

These results revealed that the native-immigrant gap was most pronounced in Greece, France, Austria, and Slovenia. In selected countries (except for the three Balkan countries—Croatia, Montenegro, and Serbia), first-generation immigrants scored significantly lower than second-generation immigrants, so their gap from native pupils was huge and ranged from 0.6 to 0.8 standard deviations. In math, the gap between first- and second-generation immigrants was slightly less pronounced but still significant in countries like Great Britain, Greece, Italy, and Slovenia.
Quantile Regression: Does the Gap Widen for High Achievers?
In most countries, the gap between second-generation immigrants and native students remained fairly stable across percentiles, with consistent trends in Austria, France, Italy, Montenegro, Serbia, Croatia, and Great Britain.
However, in Greece and Slovenia, the gap between native and immigrant students increased at the higher end of the distribution, especially in math (Figure 5). This suggests that the achievement disparity was more pronounced among higher-achieving students.

In Austria, the gap between first-generation immigrants and natives actually narrowed at the higher end of the distribution (Figure 6).However, due to the small sample sizes of first-generation immigrants in many countries, the results for this group should be interpreted with caution. Larger samples are needed to confirm these trends reliably.

Conclusions: What Sets the Balkans Apart?
In summary, Serbia, Montenegro, and Croatia stand out in contrast to the other countries in the selected sample. In both Serbia and Montenegro, there is no significant native-immigrant achievement gap. In Croatia, the gap is the smallest among other selected countries (except Great Britain). Additionally, in these countries, there is no difference in achievement between first- and second-generation immigrants, which is quite rare compared to other countries.
Interestingly, Great Britain shows a similar pattern to the Balkan countries when it comes to second-generation immigrants. While PISA scores in the UK are generally higher than in the Balkans, the pattern of achievement between native and immigrant students resembles that of the Balkan nations rather than other European countries.
The unique patterns observed in Serbia, Montenegro, and Croatia may be explained by the specific characteristics of immigrant populations in these countries. In my next posts, I’ll dive deeper into these factors, exploring the socioeconomic and educational backgrounds of immigrants, as well as their different indicators of motivation and well-being.


Comments