Estimating Grade Effect in PISA: Revisiting an Old Study
- Yulia Kuzmina
- Aug 4, 2025
- 4 min read

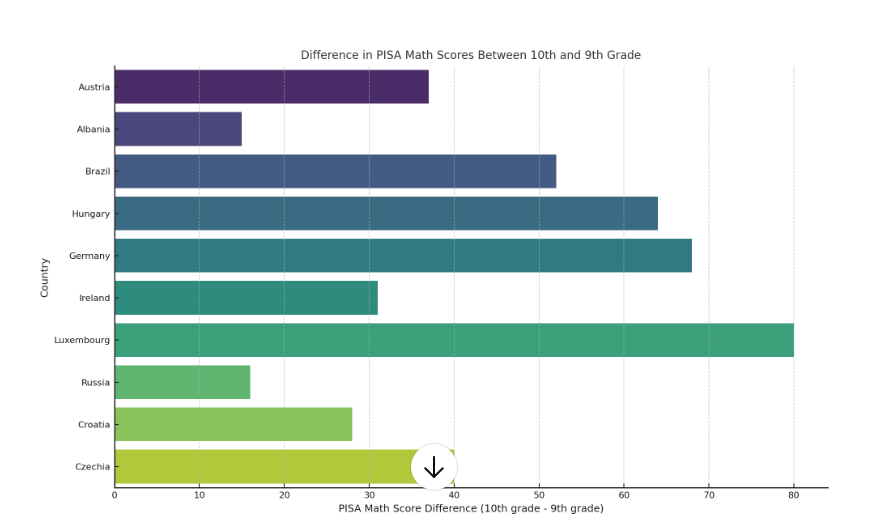
Years ago, when I was still an early-career researcher, my colleagues and I were working with PISA 2006 and 2009 data. As you know, the PISA sample includes 15-year-old students — but depending on the country, they may be in grade 8, 9, 10, or even 11. In many countries, students from two adjacent grades, for example 9th and 10th, appear in the dataset. The idea is simple: if 10th graders consistently outperform 9th graders (this is true in every country!) , perhaps this difference reflects the effectiveness of schooling or a so-called grade effect, or “the effect of one additional year of schooling”?
Look, there are noticeable gaps, but what exactly do they reflect?
Of course, it's rarely that straightforward — we can't just rely on the score gap between adjacent grades.
Why Simple Regression Doesn’t Work
A basic comparison or OLS with covariates doesn’t yield causal estimates, even approximate ones, because of confounding. Grade level isn't randomly assigned. Students in higher grades may be older, from more advantaged families and started school earlier. This introduces selection bias that can't be resolved just by adding controls.
Regression can adjust for observed variables, but fails when unobserved confounders (like parental pressure or motivation).
Quasi-Experimental Methods: Getting Closer to Causality
To deal with this, researchers often use quasi-experimental methods that aim to approximate randomized experiments using observational data.
Three prominent approaches are:
1. Regression Discontinuity Design (RDD)
2. Instrumental Variables (IV)
3. Propensity Score Matching (PSM)
Each relies on strong assumptions. If those assumptions hold (such as no unobserved confounding for PSM, or a valid instrument for IV) they can provide estimates that approximate causal effects.But if these assumptions are violated, the estimates may still be informative, just not interpretable as causal.
RD takes advantage of a known cut-off rule, such as the school-entry date, to compare individuals just above and just below the threshold. If the cut-off is strictly enforced, it creates a “natural experiment” around the boundary.
There are two types of RD:
Sharp RD: the treatment is fully determined by the threshold.
For example, imagine a country where the rule states that only children born before March 1st of a given year can enter 1st grade. If this rule is strictly enforced with no exceptions, then by the time students reach 9th or 10th grade, no one born after March 1st would be found in the higher grade, and no one born before March 1st would still be in the lower grade. In this case, the assignment to grade is entirely determined by birthdate — which satisfies the conditions for a sharp regression discontinuity design.
Fuzzy RD: the threshold only partially determines treatment (e.g., some students start school earlier or later than the rule suggests).
Key assumptions:
Units cannot precisely manipulate the assignment variable around the cut-off;
All other factors change smoothly at the threshold;
In sharp RD: treatment assignment is deterministic;
In fuzzy RD: the cut-off indicator affects treatment probabilistically.
Method 2: Instrumental Variables (IV)
IV analysis is a broader method used when the treatment is endogenous, i.e., correlated with unobserved factors that also affect the outcome.
An instrumental variable is a third variable that:
Is strongly correlated with the treatment;
Affects the outcome only through the treatment (exclusion restriction);
Is as-good-as-randomly assigned with respect to unobservables.
Fuzzy RD is a special case of IV, where the instrument is derived from a known threshold. But IV methods in general are not tied to a cut-off, they can use other natural or policy-based instruments (e.g., distance to school, policy reforms, birth order).
Key challenge: validity of the instrument - it must be strong and truly exogenous. A strong instrument means that it has a clear and substantial impact on the treatment. For example, birth month can be a strong instrument if students born earlier in the year are much more likely to be in a higher grade. An instrument is exogenous if it affects the outcome (e.g., test scores) only through its effect on the treatment (grade level) — and not in any other way.
That is, birth month must not influence test performance directly (e.g., through age-related maturity), or the instrument would violate the exclusion restriction.
Method 3: Propensity Score Matching (PSM)
Another way to approximate causal estimates is PSM.This method models the probability that a student is in 10th grade, based on observable characteristics like SES, parental education, school location, etc. Then it matches students in 9th and 10th grade with similar “propensity scores”.
PSM doesn’t account for unobserved factors — but it works where valid instruments are lacking. It estimates the Average Treatment Effect on the Treated (ATT), which is useful for policy-focused evaluation.
Because PSM assumes no unobserved confounding, it’s important to assess how robust the estimates are to potential hidden factors. One way to do this is through sensitivity analysis, where we simulate the presence of an additional strong predictor that affects both treatment and outcome. For example, we might assume there is an unmeasured variable similar in strength to socioeconomic status, and test whether the estimated ATT remains stable when it is hypothetically included.
Methods Comparison
I wrote up this comparison of fuzzy RDD and PSM — along with empirical results for 10 countries — in a paper published in Russian in 2016. (https://soc4m.ru/index.php/soc4m/article/view/3765/3527)
I still think it’s a solid piece — even if it's rarely cited. 😊
In next post I’m going to describe results of comparison RD and PSM on the sample of PISA 2009 for different countries, based on my odl published paper.
For example, in some countries, the grade effect was significant under PSM but completely disappeared under fuzzy RD — and in a few cases, it even changed direction. Why? Let’s talk about that next time.
What I’m Thinking Now
This line of work raised a question: Which method performs better — and under what conditions?
In that old paper, I didn’t know the “true” effect — so I couldn’t compare estimates to a ground truth.
But now I’m thinking of building a simulation study: Generate data with known parameters, vary assumptions (like selection bias, instrument strength, covariate overlap, proportion of non-compliers), and test how OLS, IV, and PSM perform.
This could be a next paper — and help others choose the right causal tools for complex educational datasets.


Comments